
In one of our previous articles, we explained why natural gas traders should care about the latest trends in the Electric Power sector and what indicators they should be monitoring. In this article, we would simply like to update you on some of the latest trends.
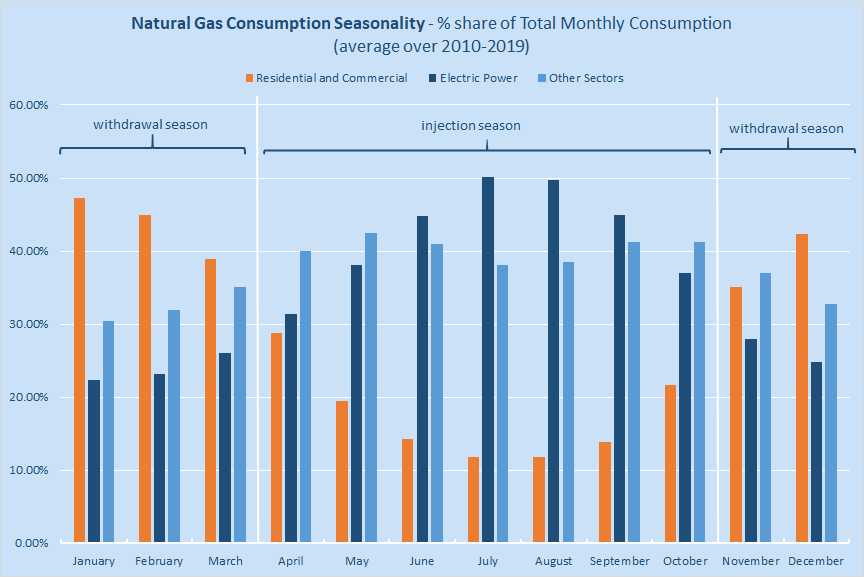
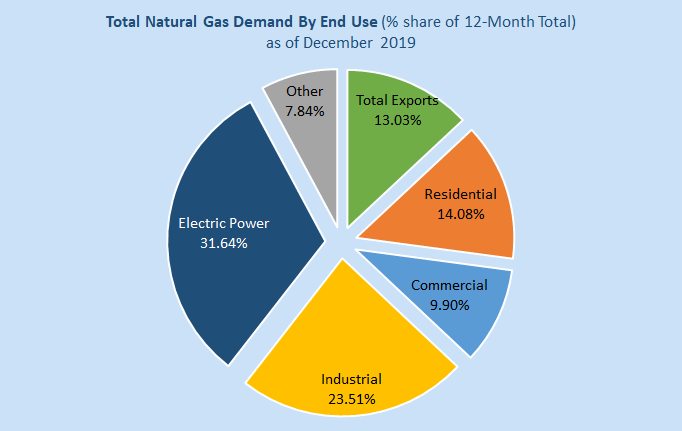
As you know, Electric Power sector is the primary consumer of natural gas in the United States. Its share in the annual demand structure is more than 31%, while its share in the injection season demand is close to 50% (see the charts below).
Source: Energy Information Administration, Bluegold Research estimates, and calculations
Source: Energy Information Administration, Bluegold Research estimates, and calculations
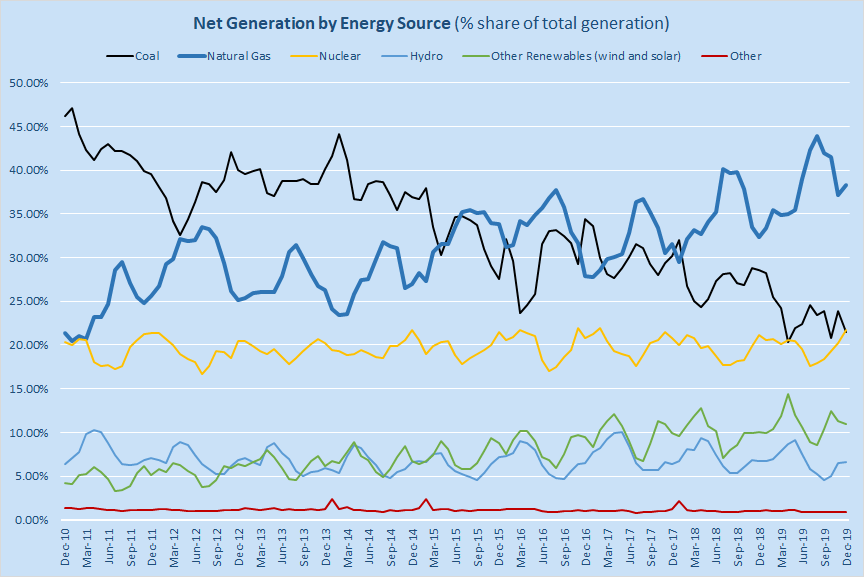
The latest data indicates that the weight of the Electric Power sector in the natural gas market continues to grow. The EIA’s latest Electric Power Monthly Report shows that, in December, the share of total electricity supplied by natural gas-fired power plants has increased by almost six percentage points y-o-y (from 32.40% to 38.35% – see the chart below). It was the largest share of natural gas-fired generation ever recorded in the month of December. At the same time, the share of coal-fired generation has dropped by more than seven percentage points over the same period to 21.51%.
Source: Energy Information Administration, Bluegold Research estimates, and calculations
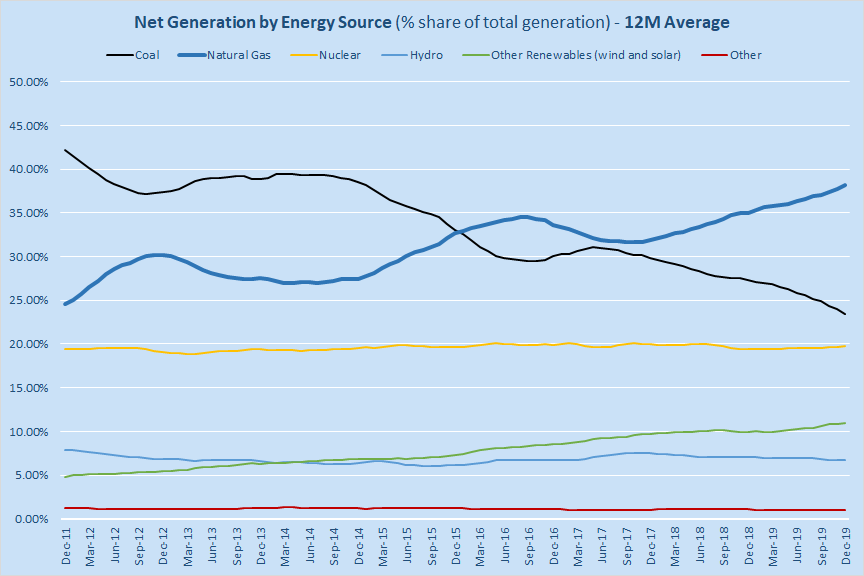
These latest trends are important for several reasons. Firstly, the share of natural gas usage for electricity generation increased even as the total electric output went down. According to Edison Electric Institute, United States produced 337 TW/h of power in December 2019, some 0.4% less than a year ago. Secondly, natural gas remained the fastest-growing source of power among all other sources (not just compared to coal). The share of renewables (hydro, wind, and solar) has also increased in annual terms, but to a lesser extent.
Source: Energy Information Administration, Bluegold Research estimates, and calculations
Still, coal remains the second most important source of electricity generation in the United States, followed by nuclear power, “other renewables” (wind and solar) and hydro. Therefore, coal-to-gas switching continues to be an important element in our natural gas consumption models.
According to our calculations, average NG/Coal spread currently stands at around $0.29 per MMbtu, down 69.8% y-o-y and down as much as 75.3% vs. the five-year average. On a cent per KWh basis (which takes into account energy content and power plants’ heat rates), the spread is around 0.13 per KWh – down as much as 78.0% vs. the five-year average and down 70.0% y-o-y (see the charts below).
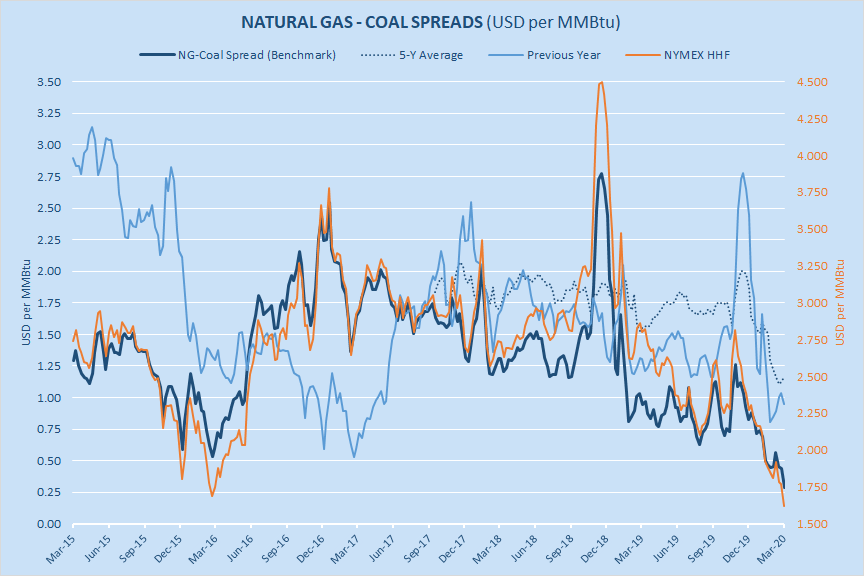
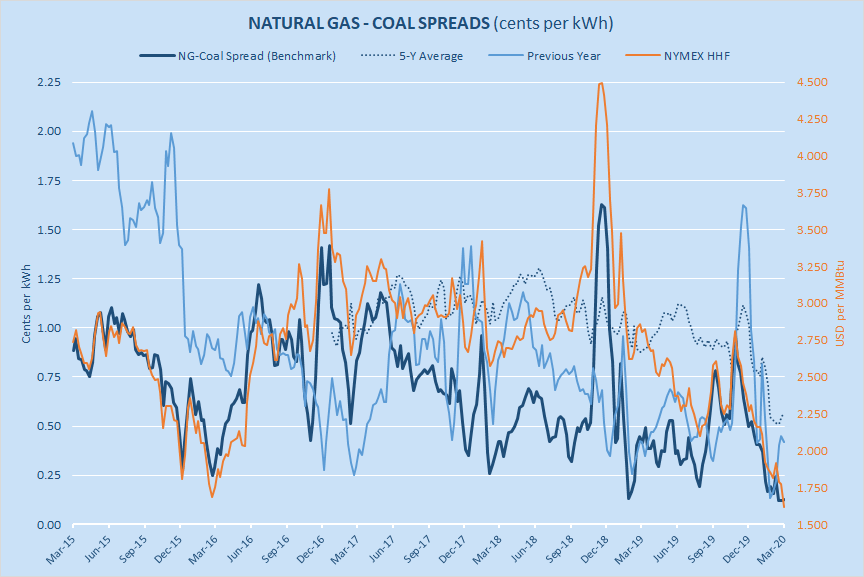
Source: CME Group, Energy Information Administration, Bluegold Research estimates, and calculations
Given that the price of natural gas has dropped by more than 8% m-o-m, while the average price of coal remained essentially unchanged (over the same period), NG/Coal spread has totally plunged, meaning that natural gas became more competitive (vs. coal) as a “feedstock” for electricity generation. Indeed, no matter how you measure it, but natural gas has never ever been so competitive (vs. coal) as it is today.
When estimating the spreads between natural gas and coal, it is important to remember that natural gas-fired power plants tend to be more efficient than coal-fired power plants. In other words, the heat rate (measured in BTU per kilowatt-hour) is lower for natural gas-fired power plants than it is for coal-fired power plants. Therefore, even relatively high NG/Coal spreads are still making natural gas very competitive as a source of electricity generation (compared to coal) – especially, when adjusting for additional environmental benefits.
As of today, coal-to-gas switching trend remains exceptionally strong (in absolute terms), with lower natural gas prices and lower NG/Coal spreads having an additional positive impact. We estimate that coal-to-gas-switching currently stands at around 8.4 bcf/d, some 1.2 bcf/d above the five-year average and 1.6 bcf/d above last year’s level (see the charts below).
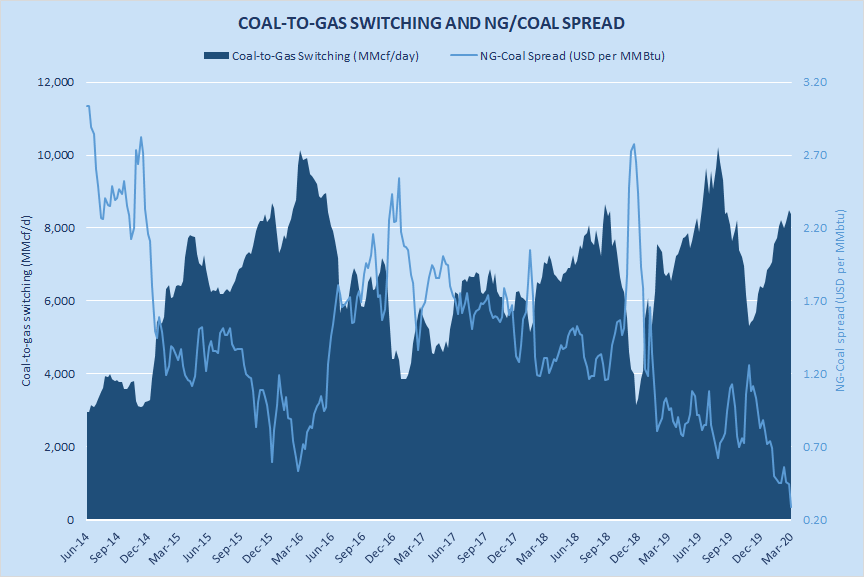
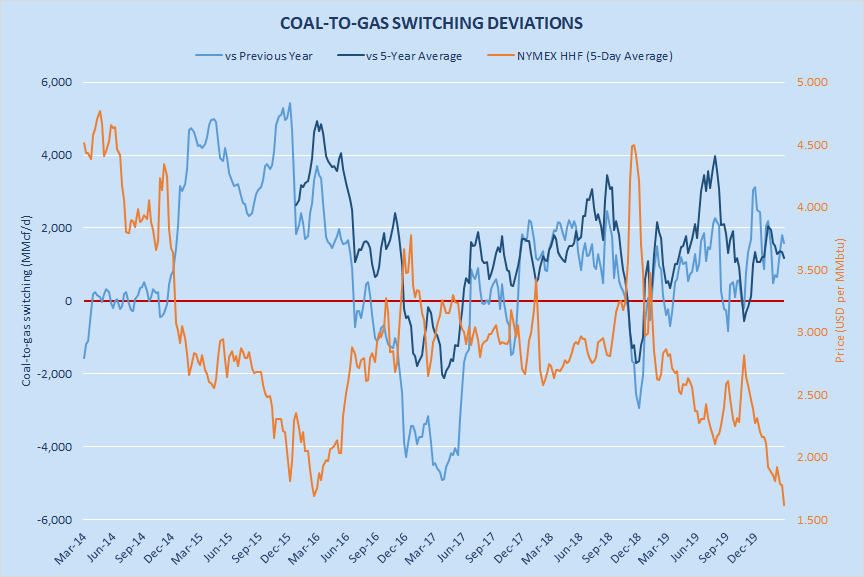
Source: CME Group, Energy Information Administration, Bluegold Research estimates, and calculations
Note:
- Lower natural gas prices (relative to coal) lead to higher levels of coal-to-gas switching (and vice versa).
- The lower the price > the higher is the level of coal-to-gas-switching > the greater is total consumption (specifically in the Electric Power sector) > the greater is the total demand > the stronger is the “bullish pressure” on the EOS storage.
- The economics of fuel-switching is an important element in natural gas trading but mostly during the injection season (roughly, April-September)
Power Plants
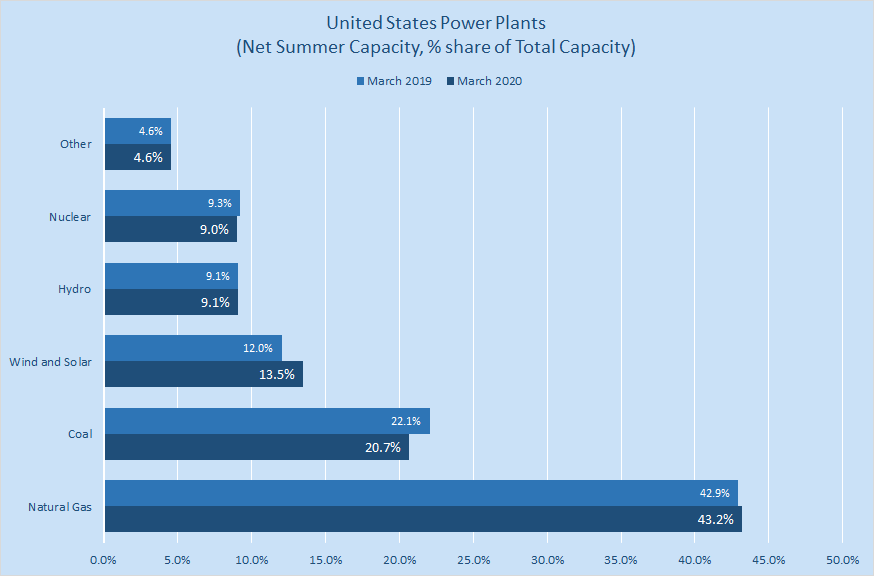
The total stock of natural gas-fired power plants is expected to increase by 1.6% y-o-y in March 2020 to 468.5 GW of net summer capacity, which will amount to 43.20% of total operating generation capacity in the United States. Conversely, due to the ongoing retirements of old and ineffective generators, the total stock of coal-fired power plants will fall to 224.1 GW (-5.4% y-o-y), just 20.7% of total capacity – see the chart below.
However, the positive effect on gas usage in the Electric Power sector will be partly offset by the rising share of renewables. Indeed, wind and solar capacity are expected to grow by 11.70% and 17.80% y-o-y, respectively. Therefore, total annualized net effect* from the changes in generation capacity additions in March 2020 is estimated to be slightly negative at around -100 MW of net gas-fired capacity.
Source: Energy Information Administration, Bluegold Research estimates, and calculations
*Total annualized net effect on gas usage from changes in generation capacity = natural gas net additions + coal retirements – natural gas retirements – coal additions – nuclear additions – wind, hydro, and solar additions + retirements of renewables and nuclear = -100 MW of natural gas-fired generation in March 2020.
Renewables
The share of “other renewables” (wind and solar) is growing very fast. Together, they have already overtaken hydro and nuclear power. Previously, in an attempt to estimate the impact of non-degree day factors on the potential natural gas consumption in the electric power sector, analysts would look at the schedule of nuclear outages to try to figure out how many nuclear megawatts will be replaced by natural gas. They would also study the level of snowpack to estimate hydro inflows and eliminate it from total calculations.
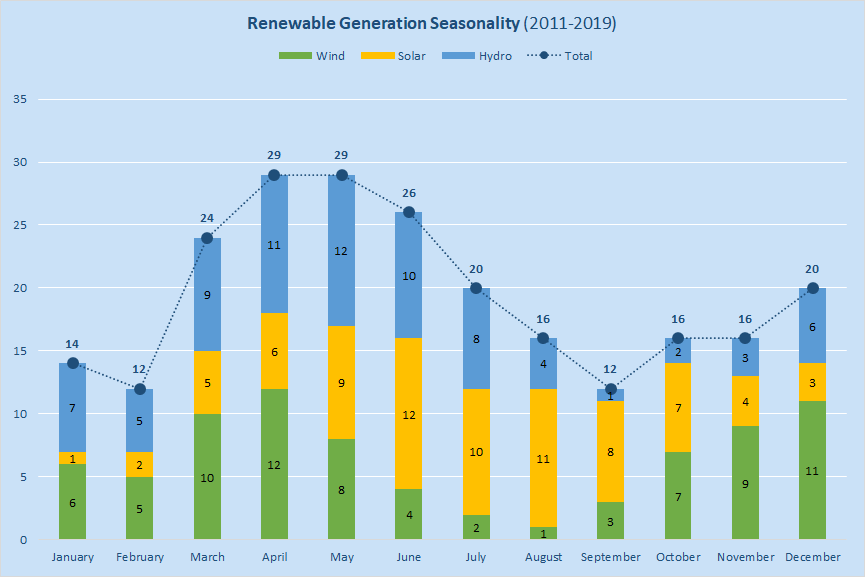
Today, however, analysts must also study wind speeds and the levels of solar radiation, since the influence of “other renewables” can no longer be ignored. In this regard, please note that, out of 12 calendar months, March has historically been one of the “strongest” months for renewable power (see full ranking in the chart below). At this point in time, we estimate that, in March this year, wind, hydro, and solar generation will displace no less than 6.0 bcf/d of potential natural gas consumption in the Electric Power sector.
Source: Energy Information Administration, Bluegold Research estimates, and calculations
It is important to understand the key features of electricity generation from renewable sources. One of the most important features is natural seasonality. Renewable energy (in our case, wind, solar and hydro) is derived from natural processes, which cannot be controlled by humans (for example, sunlight and wind). Perhaps, only hydro generation can be partially controlled, but it is also heavily influenced by precipitation and melting snowpack in the Pacific Northwest. In the chart above, we have ranked 12 calendar months in terms of their ability to provide “natural fuels” for renewable electricity generation. The ranking is based on an annual percentile basis and ranges from 1 to 12 for every type of renewable energy. 1 – weakest; 12 – strongest.
For example:
- In January, there are more cloudy days than clear days, and sunny days are shorter, so solar generation is at its weakest. Therefore, we give only 1 point to solar energy in January.
- In April, melting snowpack is increasing water flows, and hydroelectric output is increasing. Therefore, we give 11 points to hydro energy in March.
- In most regions, average wind speeds slow down during the summer, and wind generation is at its weakest in August. Therefore, we give only 1 point to wind energy in August. At the same time, August tends to have fewer cloudy days and longer sunny days, so solar generation is very strong (11 points).
Total Supply/Demand Balance
The fuel substitution element in our consumption models is very bullish for natural gas prices (ceteris paribus). However, the net effect on natural gas consumption is slightly “less bullish” because there are other elements within the Electric Power natural gas consumption model which have both positive and negative implications.
Electric Power natural gas consumption model = NG-Coal spread + coal-to-gas switching curve + nuclear outages + coal outages – gas outages – hydro/wind/solar generation.
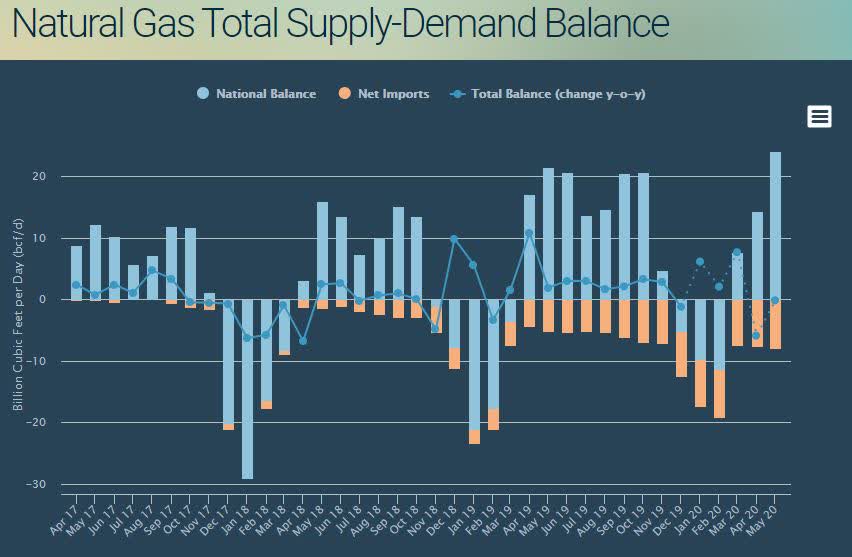
On balance, however, when we factor in other market variables such as production, imports, exports, and weather-induced consumption by other users, we estimate that total natural gas supply-demand balance in March will be looser than last year by around +7.6 bcf/day (see the chart below). In absolute terms, this is a bearish signal. The annual change in total balance is projected to be positive, meaning that, in March 2020, annual storage “surplus” is likely to expand.
At the same time, supply/demand balance is projected to turn into “deficit” in April (-5.94 bcf/d vs. April 2019).
Source: Energy Information Administration, Bluegold Research estimates, and calculations
Thank you for reading this article. We also write daily and weekly reports, covering key variables in U.S. natural gas market (supply, demand, storage, prices and more). We provide the following to subscribers:
We are offering a two-week free trial, and we will soon begin to cover global LNG market. Come and join us.
Disclosure: I/we have no positions in any stocks mentioned, and no plans to initiate any positions within the next 72 hours. I wrote this article myself, and it expresses my own opinions. I am not receiving compensation for it (other than from Seeking Alpha). I have no business relationship with any company whose stock is mentioned in this article.